
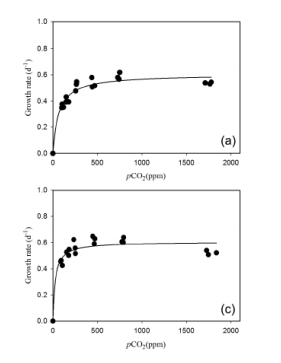
CO2 functional response curves showing specific growth rates (and fitted curves) across a range of CO2 concentrations from ∼ 100 to ∼ 1730 ppm at 2 and at 8 ◦C. Pseudo-nitzschia subcurvata at 2 ◦C (a) and Phaeocystis antarctica at 2 (c) . Values represent the means and error bars represents the standard deviations of triplicate samples
Zhu, Zhi, et al. 2017. Individual and interactive effects of warming and CO2 on Pseudo-nitzschia subcurvata and Phaeocystis antarctica, two dominant phytoplankton from the Ross Sea, Antarctica. Biogeosciences 14(23): 5281-5295.