Simulator
What MEDDLE CAN DO
The MEDDLE simulator is a computer model that mimics some typical responses of marine organisms to multiple drivers. It allows to run several virtual laboratory experiments by setting the combined levels of the drivers, choosing the number of replicates, and considering natural variability. The MEDDLE simulator trains you in confronting with the complexity of realistic experiments. This is done through the comparison of your simulation results against the theoretical, computer-generated response of a model organism.

What MEDDLE CAN’T DO
MEDDLE is not meant to run realistic simulations of organismal responses to environmental stressors. The mathematical model is based on realistic response curves, but their combination is arbitrary and assembled for pedagogical reasons. The prescribed theoretical response is for reference only: it cannot be tuned to a specific organism, nor can the drivers be directly identified as environmental variables such as temperature, carbon dioxide, etc. MEDDLE is provided for supporting (not replacing) your own experimental design and for illustrating the role of mathematical models to improve the understanding of marine systems.

Time to MEDDLE!
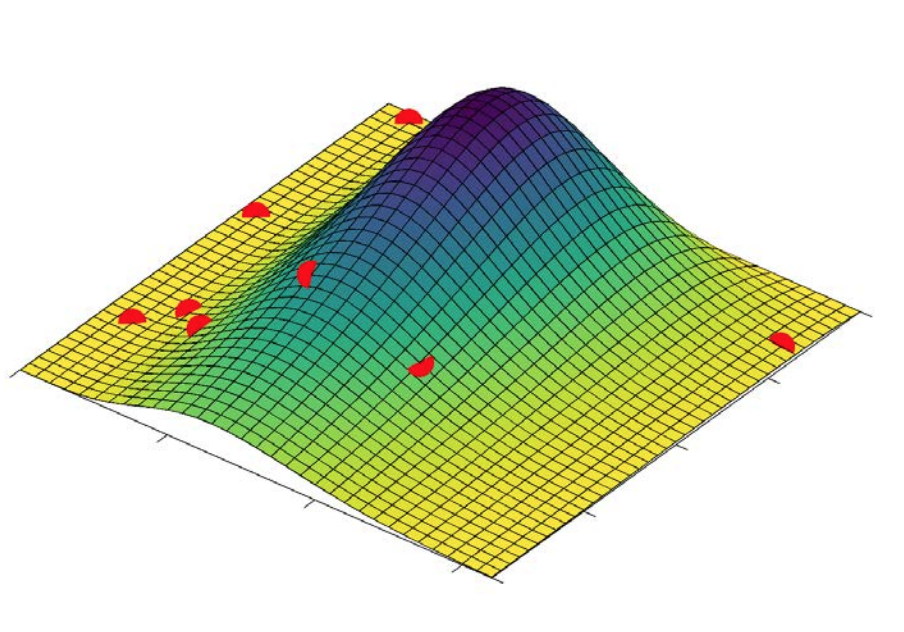
This is the starting point of your journey with MEDDLE. You can move back and forth along the steps above, designing and refining your experiments several times. The response of an organism to multiple environmental drivers can be imagined as a landscape, and MEDDLE is a tool where you can design experiments to understand the different ways to explore this landscape.
It is important to know how you will analyze your data before your experiment. Use your simulated results to see if your design and analysis are appropriate for answering your question. You may want to begin by watching the videos on design and stats.

MEDDLE drivers
Remember that MEDDLE uses idealized drivers (we made them up). You can test your experimental design on up to three generic idealized drivers (1, 2, 3). The drivers interact in different ways, and there is random variability in the data. This leads to a range of outcomes, so every time you repeat your experiment, it will be different. Depending how you design your experiment, you will sample the landscape differently. Keep in mind that your experiment needs to be a doable size!
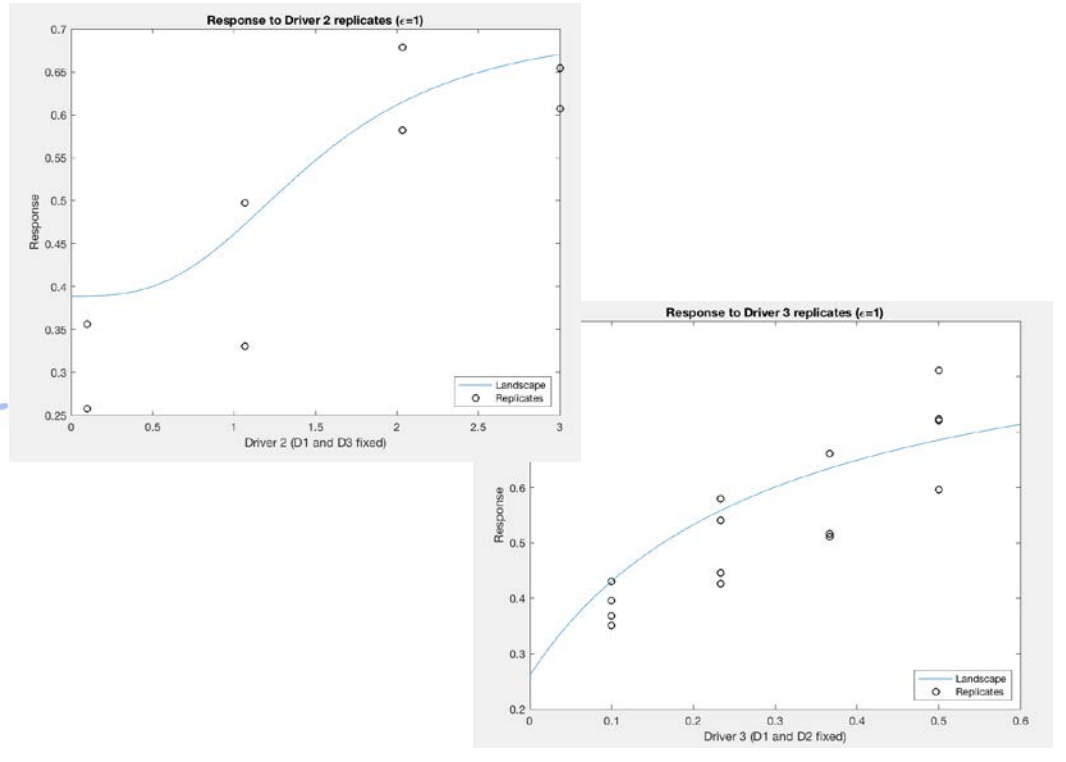
Here are examples of response curves for the three single drivers when they are acting alone (this should look familiar). In your experiment, these drivers will interact to produce a landscape.
Visualizing driver interactions
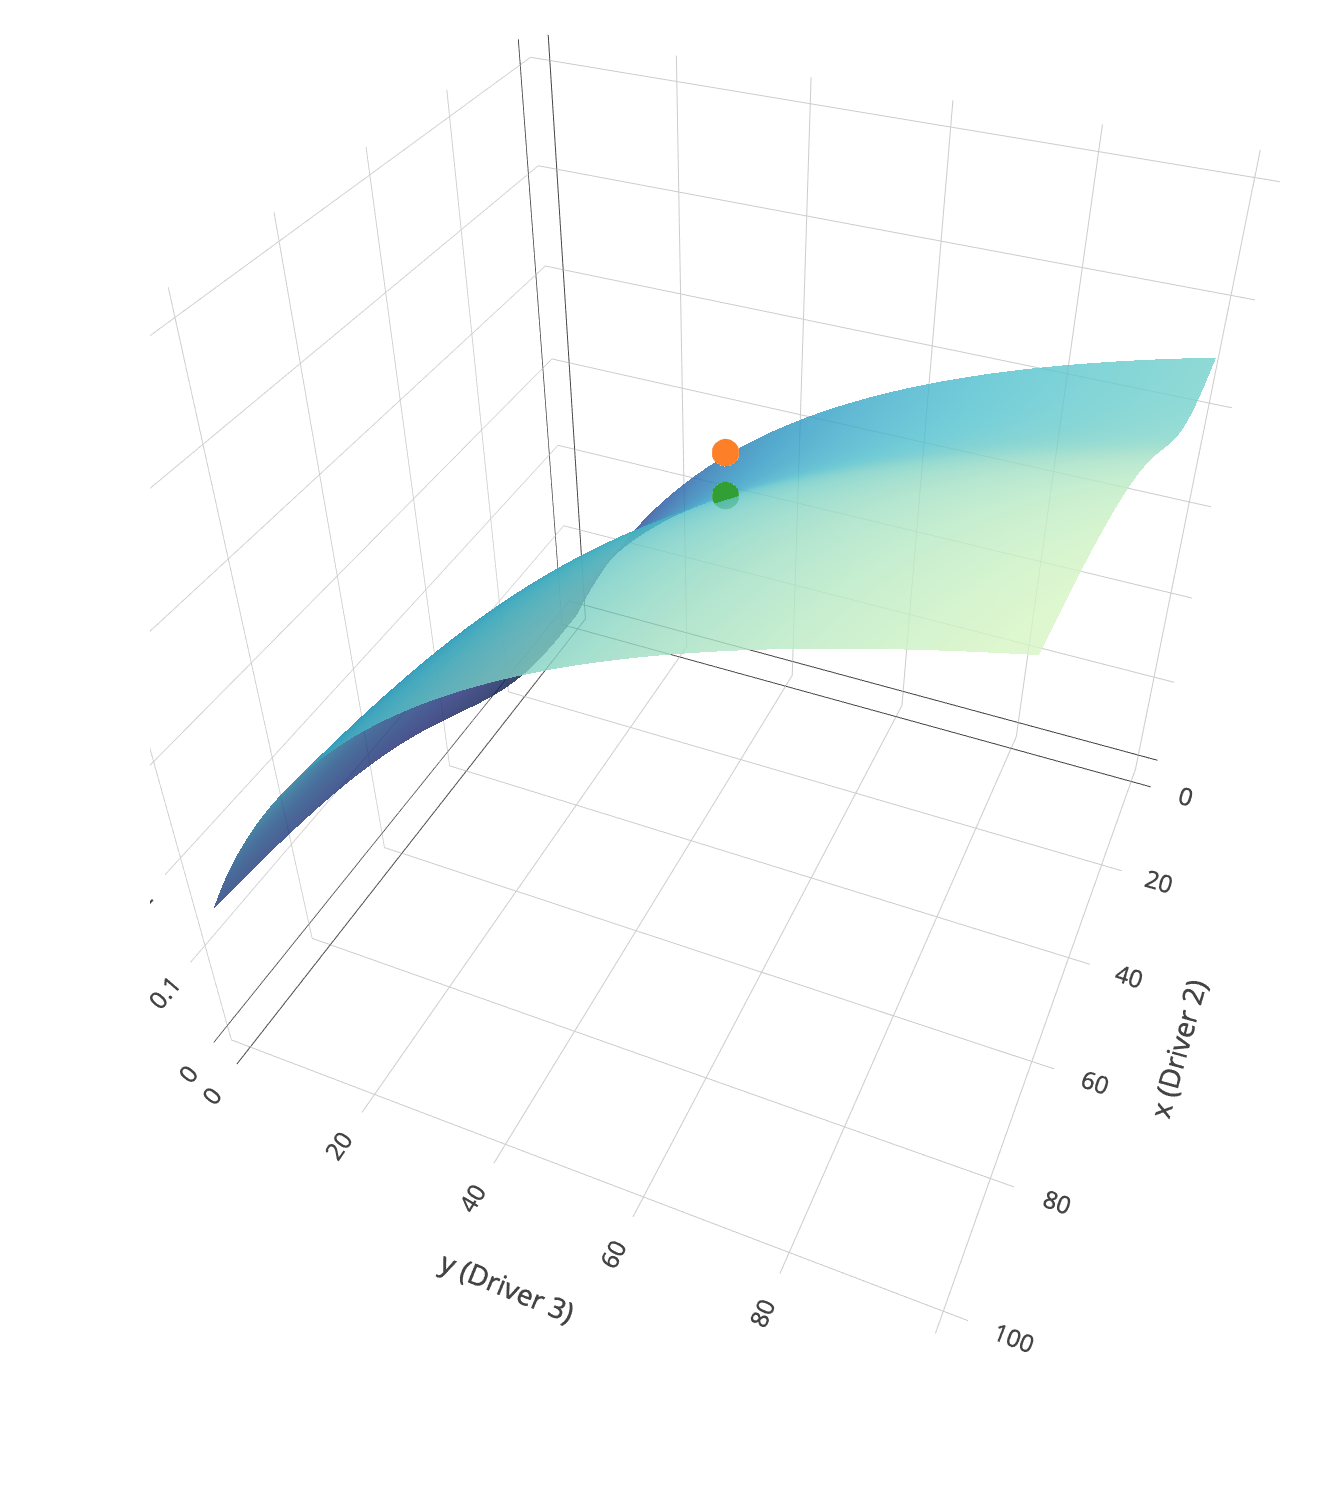
The effects of multiple interacting drivers on an organism, population, or community can be visualized using a virtual landscape, where 1 axis is the trait of interest (say, cell size, respiration rate or diversity), which is called “Response” above. All of the other axes are values for the drivers.
You can decide to show the landscape to assist your understanding. Remember that button will not be available in real life experiments, where we don’t know what the actual landscapes look like! Use MEDDLE to learn to design good experiments that can help you to reconstruct your unknown landscape.
Random variability in data
Data always has noise (which is captured in the error term of your analysis). The level of noise that you expect in your data, along with the effect size, affects the number of replicates you will need in each treatment to detect a signal.
In MEDDLE you can select the level of noise.
Sampling landscapes – what is there vs. what your experiment lets you see
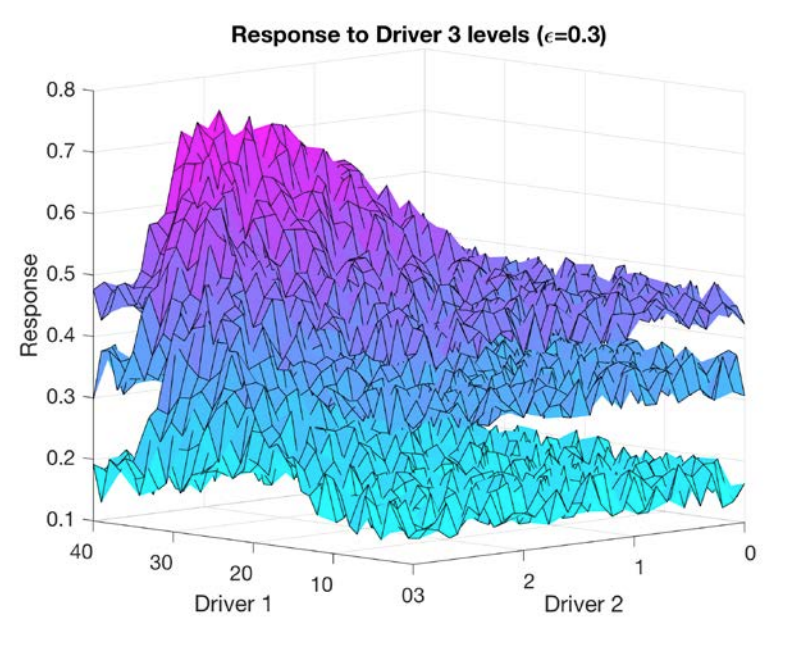
The simulator allows you to choose different driver combinations that each produce a different surface to analyse. You can experiment with 1, 2 or 3 drivers, depending on the complexity of your experiment. You cannot visualize a figure with 4 axes; when testing 3 drivers you will need to run several experiments at different values of the 3rd driver to see the surfaces.
However, keep in mind the number of treatments needed to carry out your experiment increases dramatically with complexity. To find out more about this click here.
Size of your experiment
The size of an experiment can explode quickly! If you have started designing something impossibly large, see the videos on experimental design and statistics. Is there is a way to answer your question with a smaller experiment by balancing the number of treatments and levels? This is what models are for: to explore various possibilities so that you understand the tradeoffs before starting in on a real experiment.
What do I do with my data?
Now it’s time to analyse the dataset from your experiment. This will help you determine if your design is good, adequate (i.e., in need of refinement) or inadequate (in need of major refinement, or indeed re-design).
MEDDLE offers you three steps towards analysing your data: first steps, intermediate steps, and advanced steps.
First steps
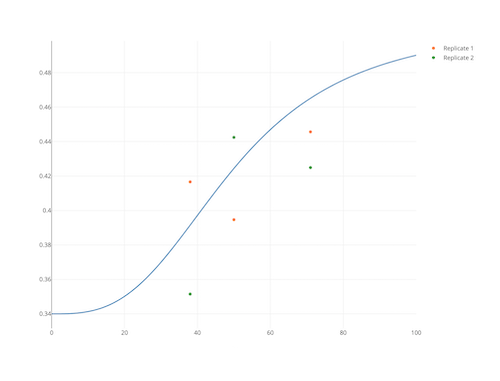
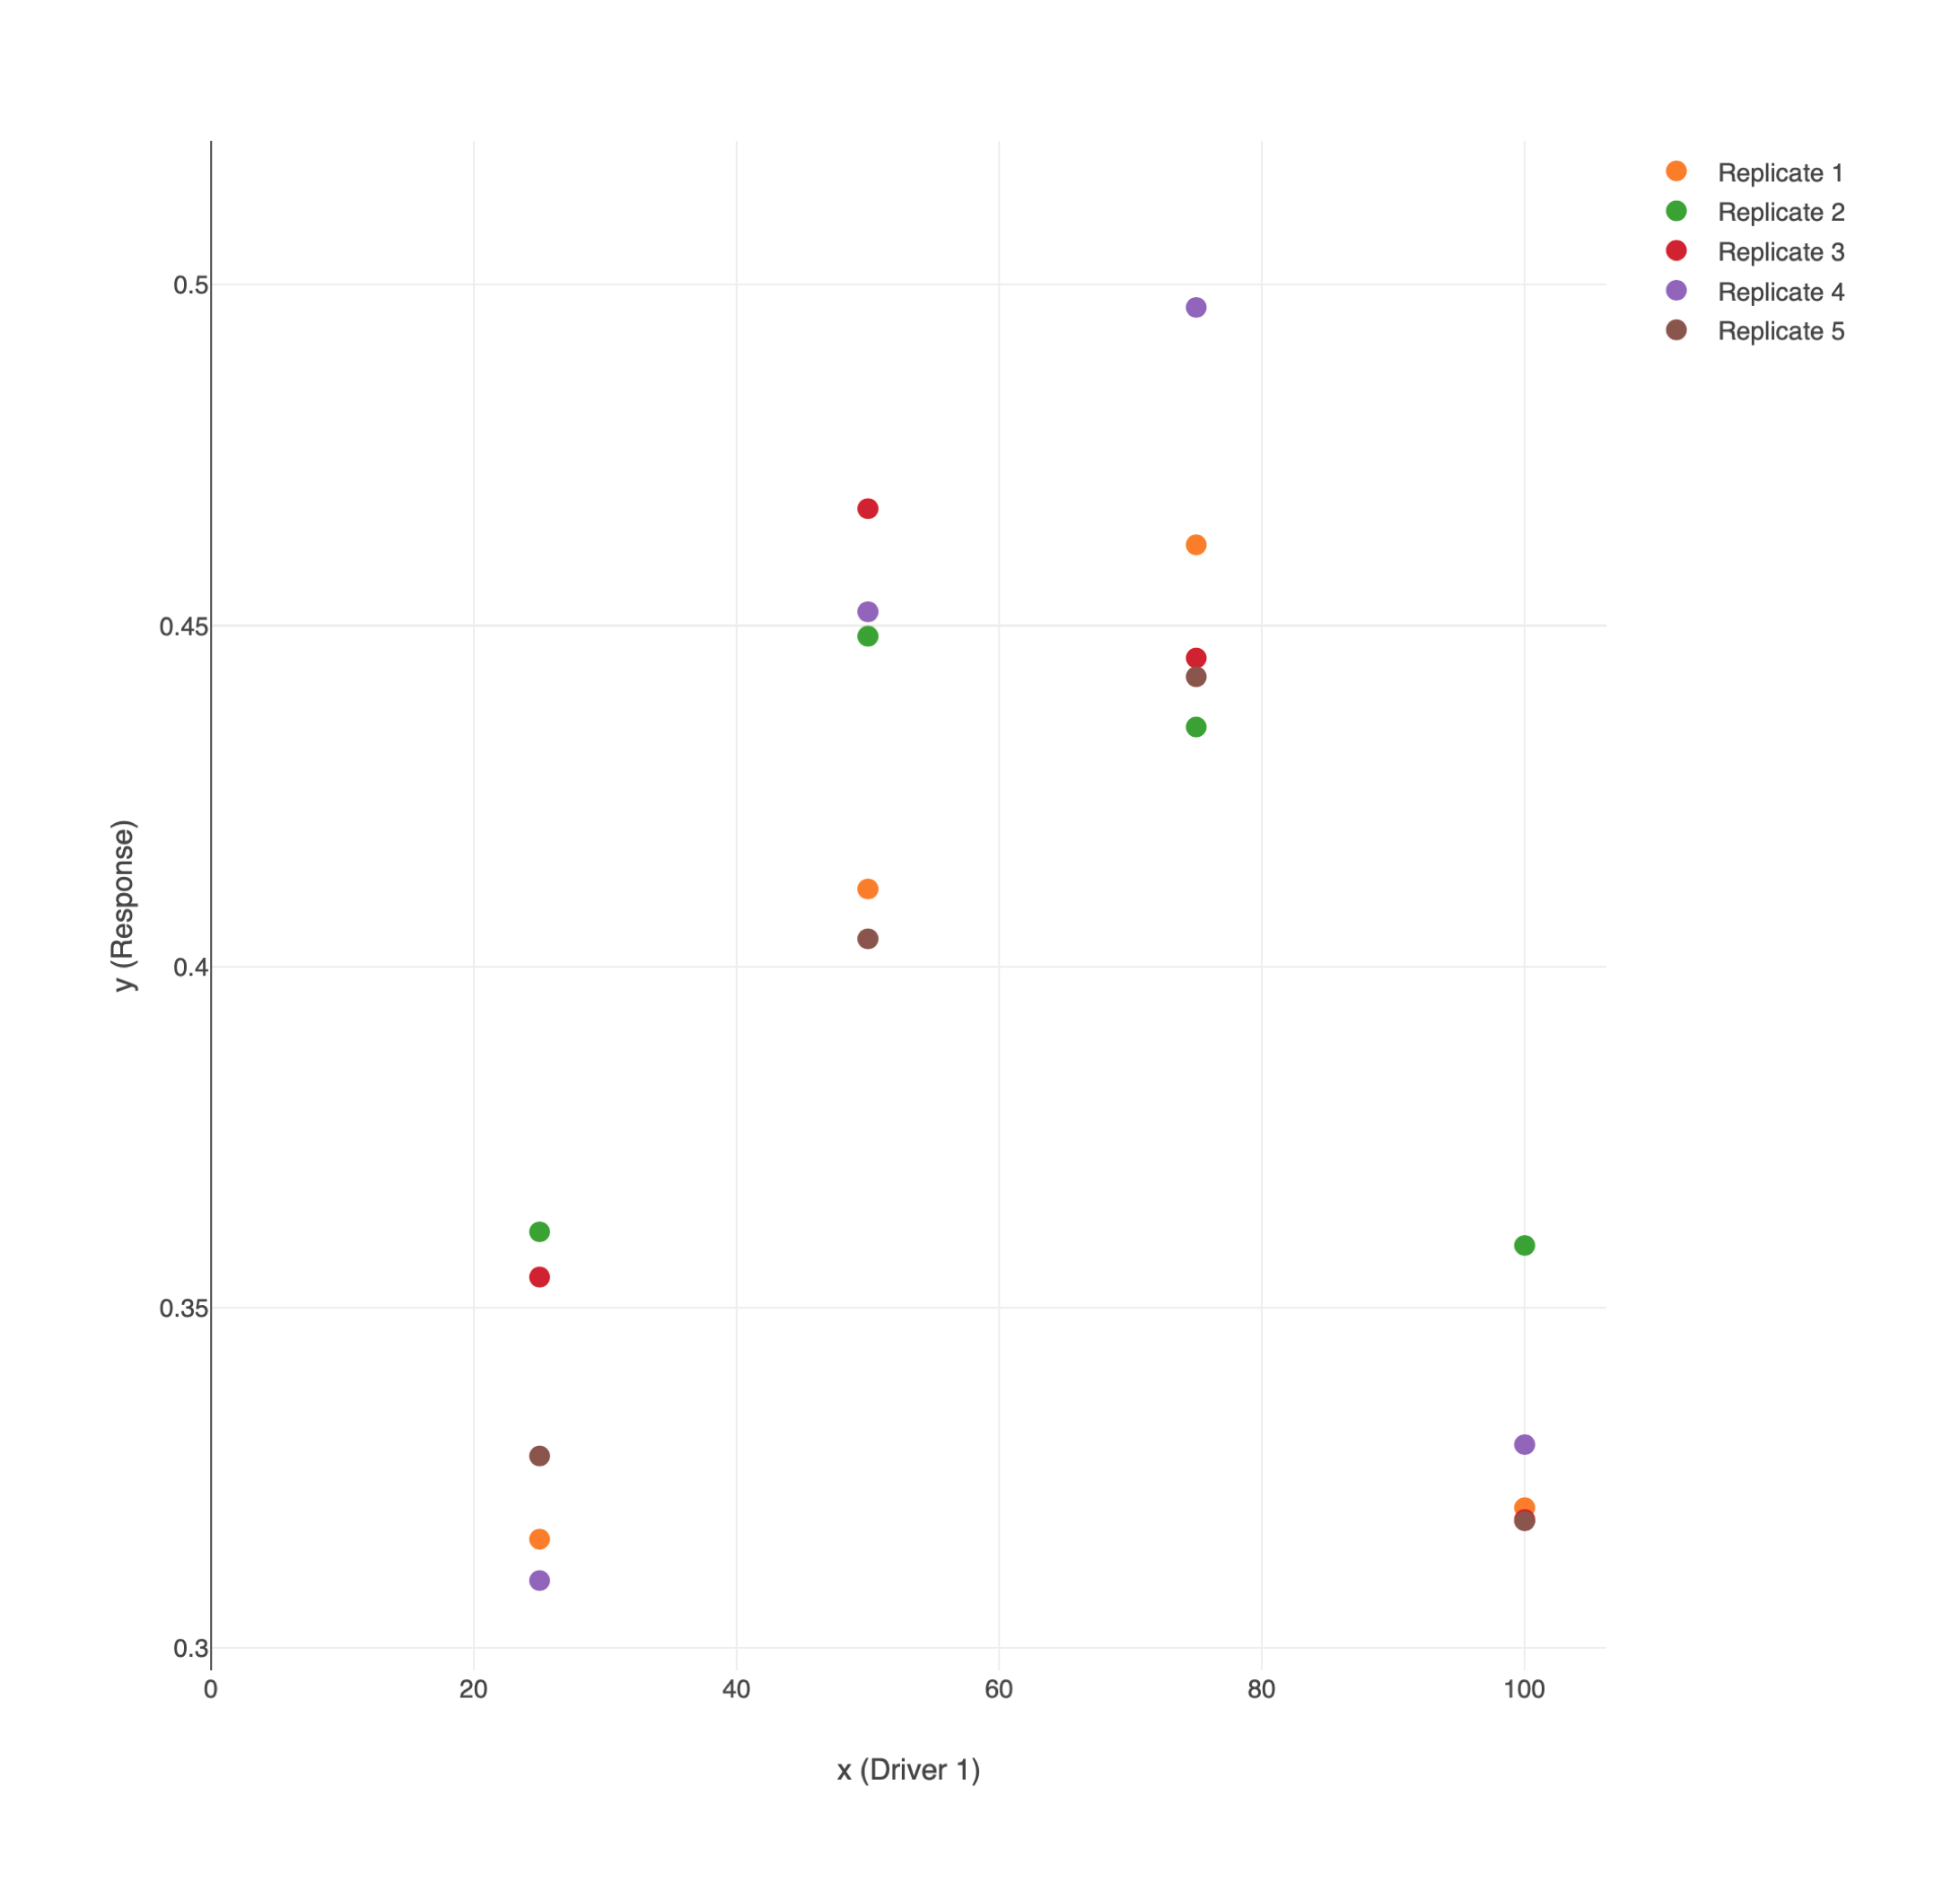
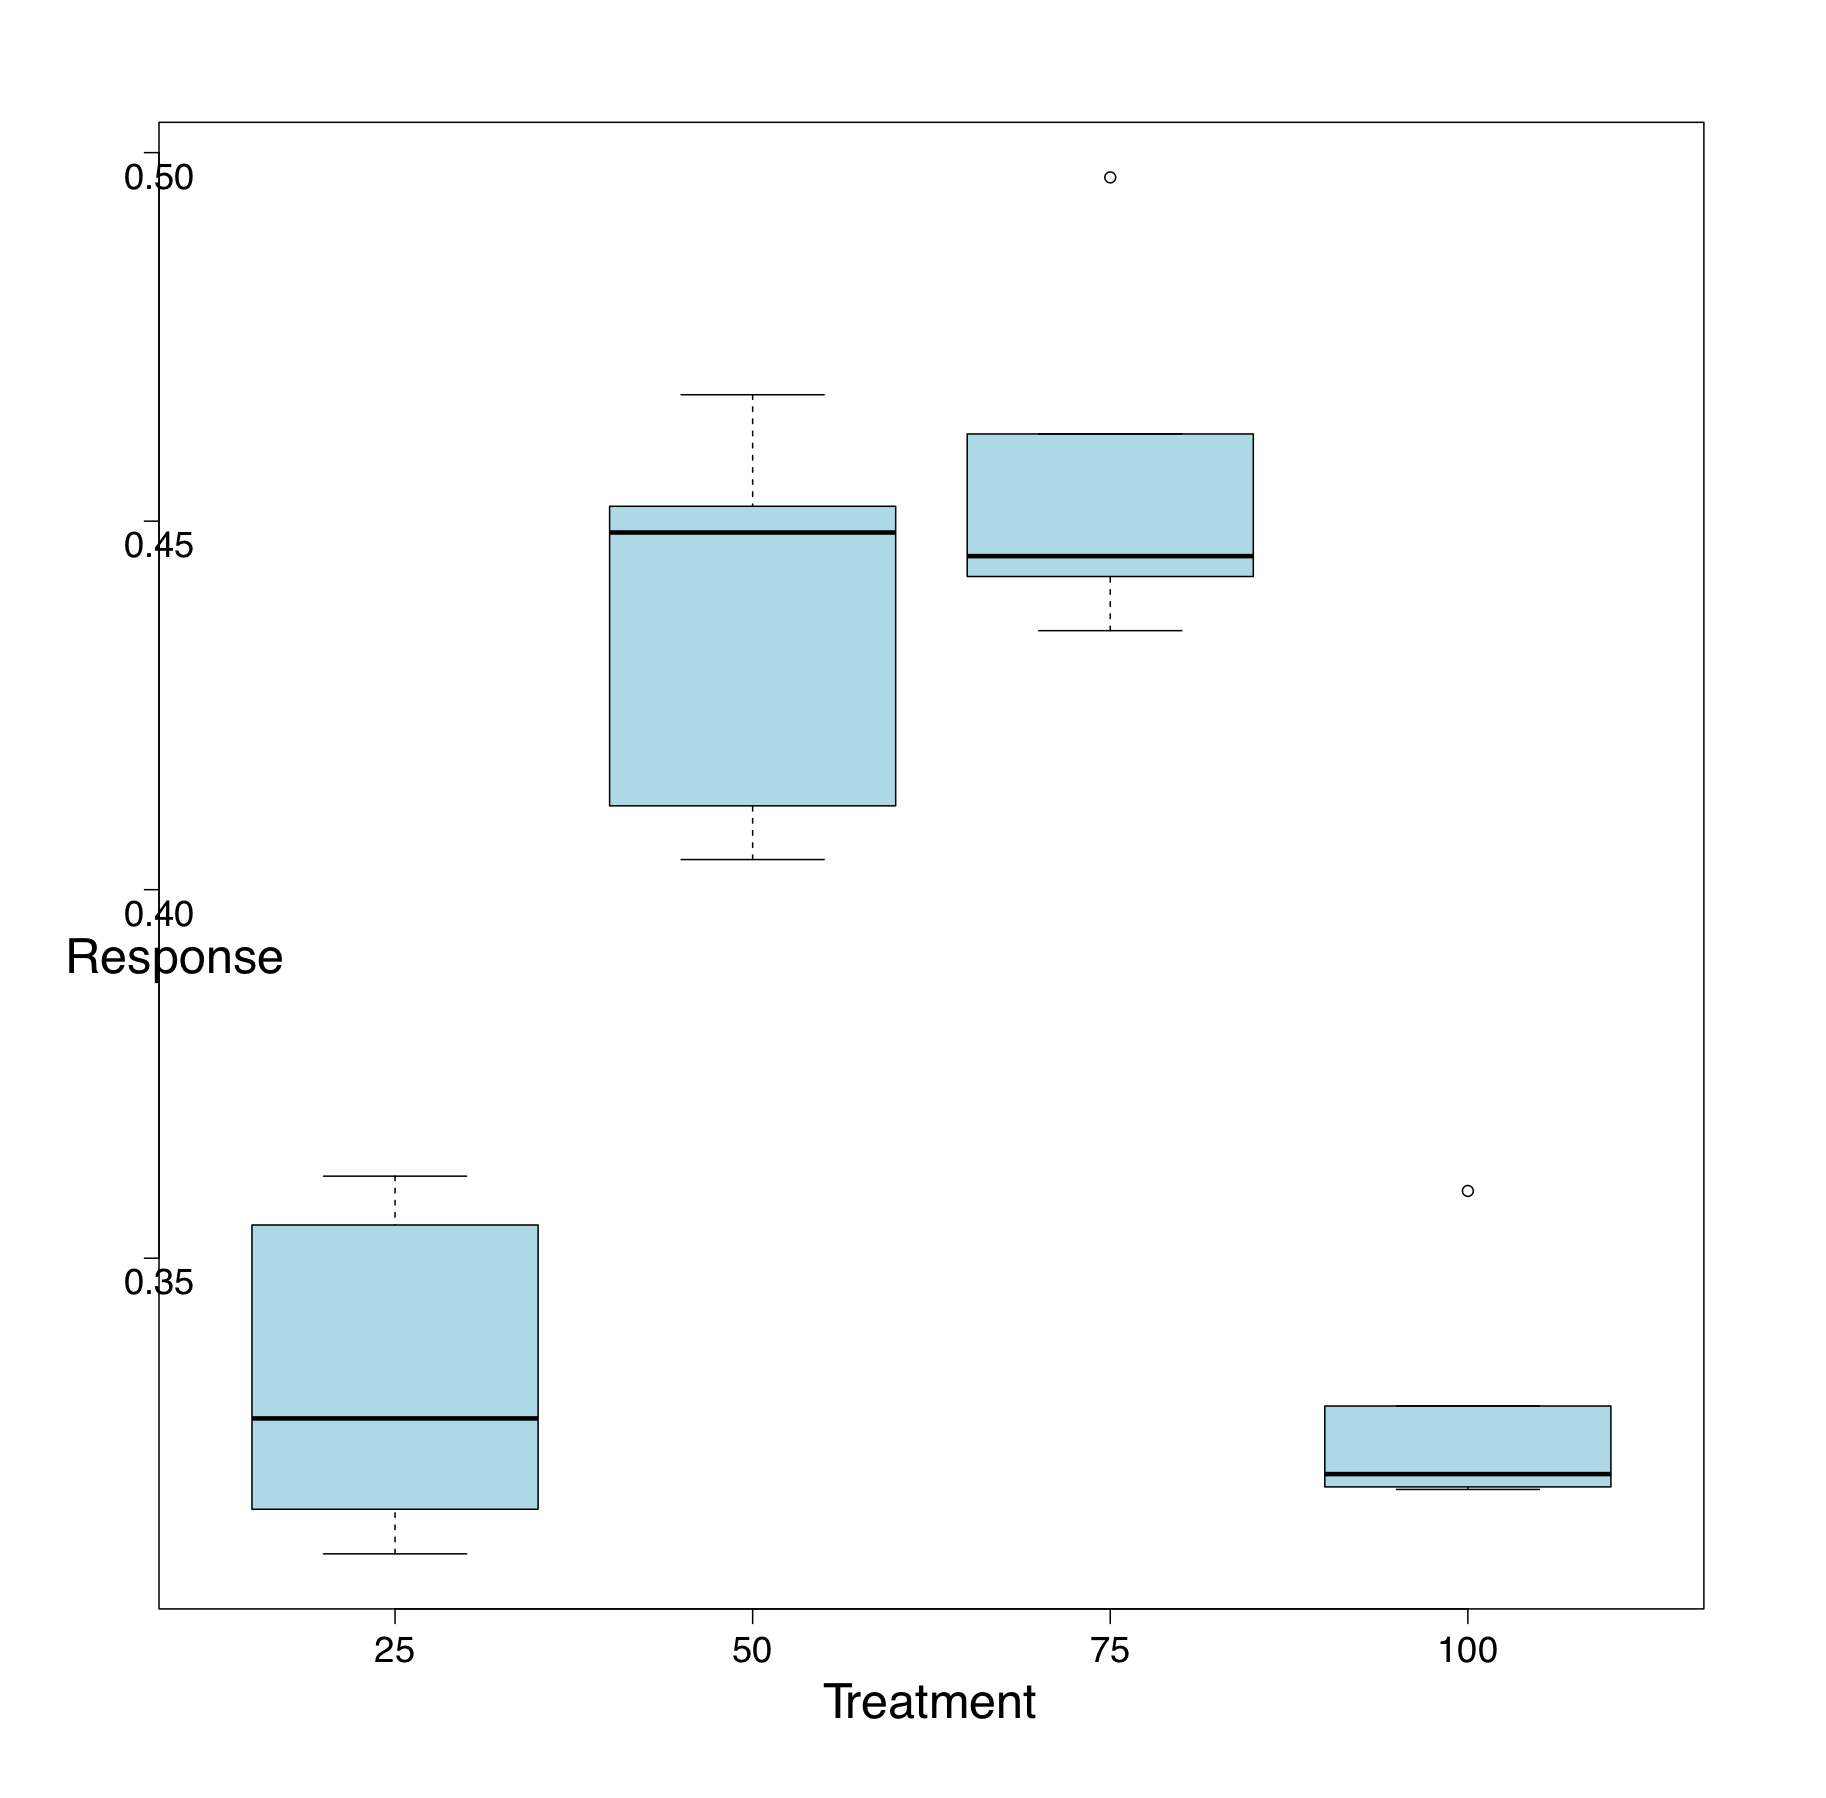
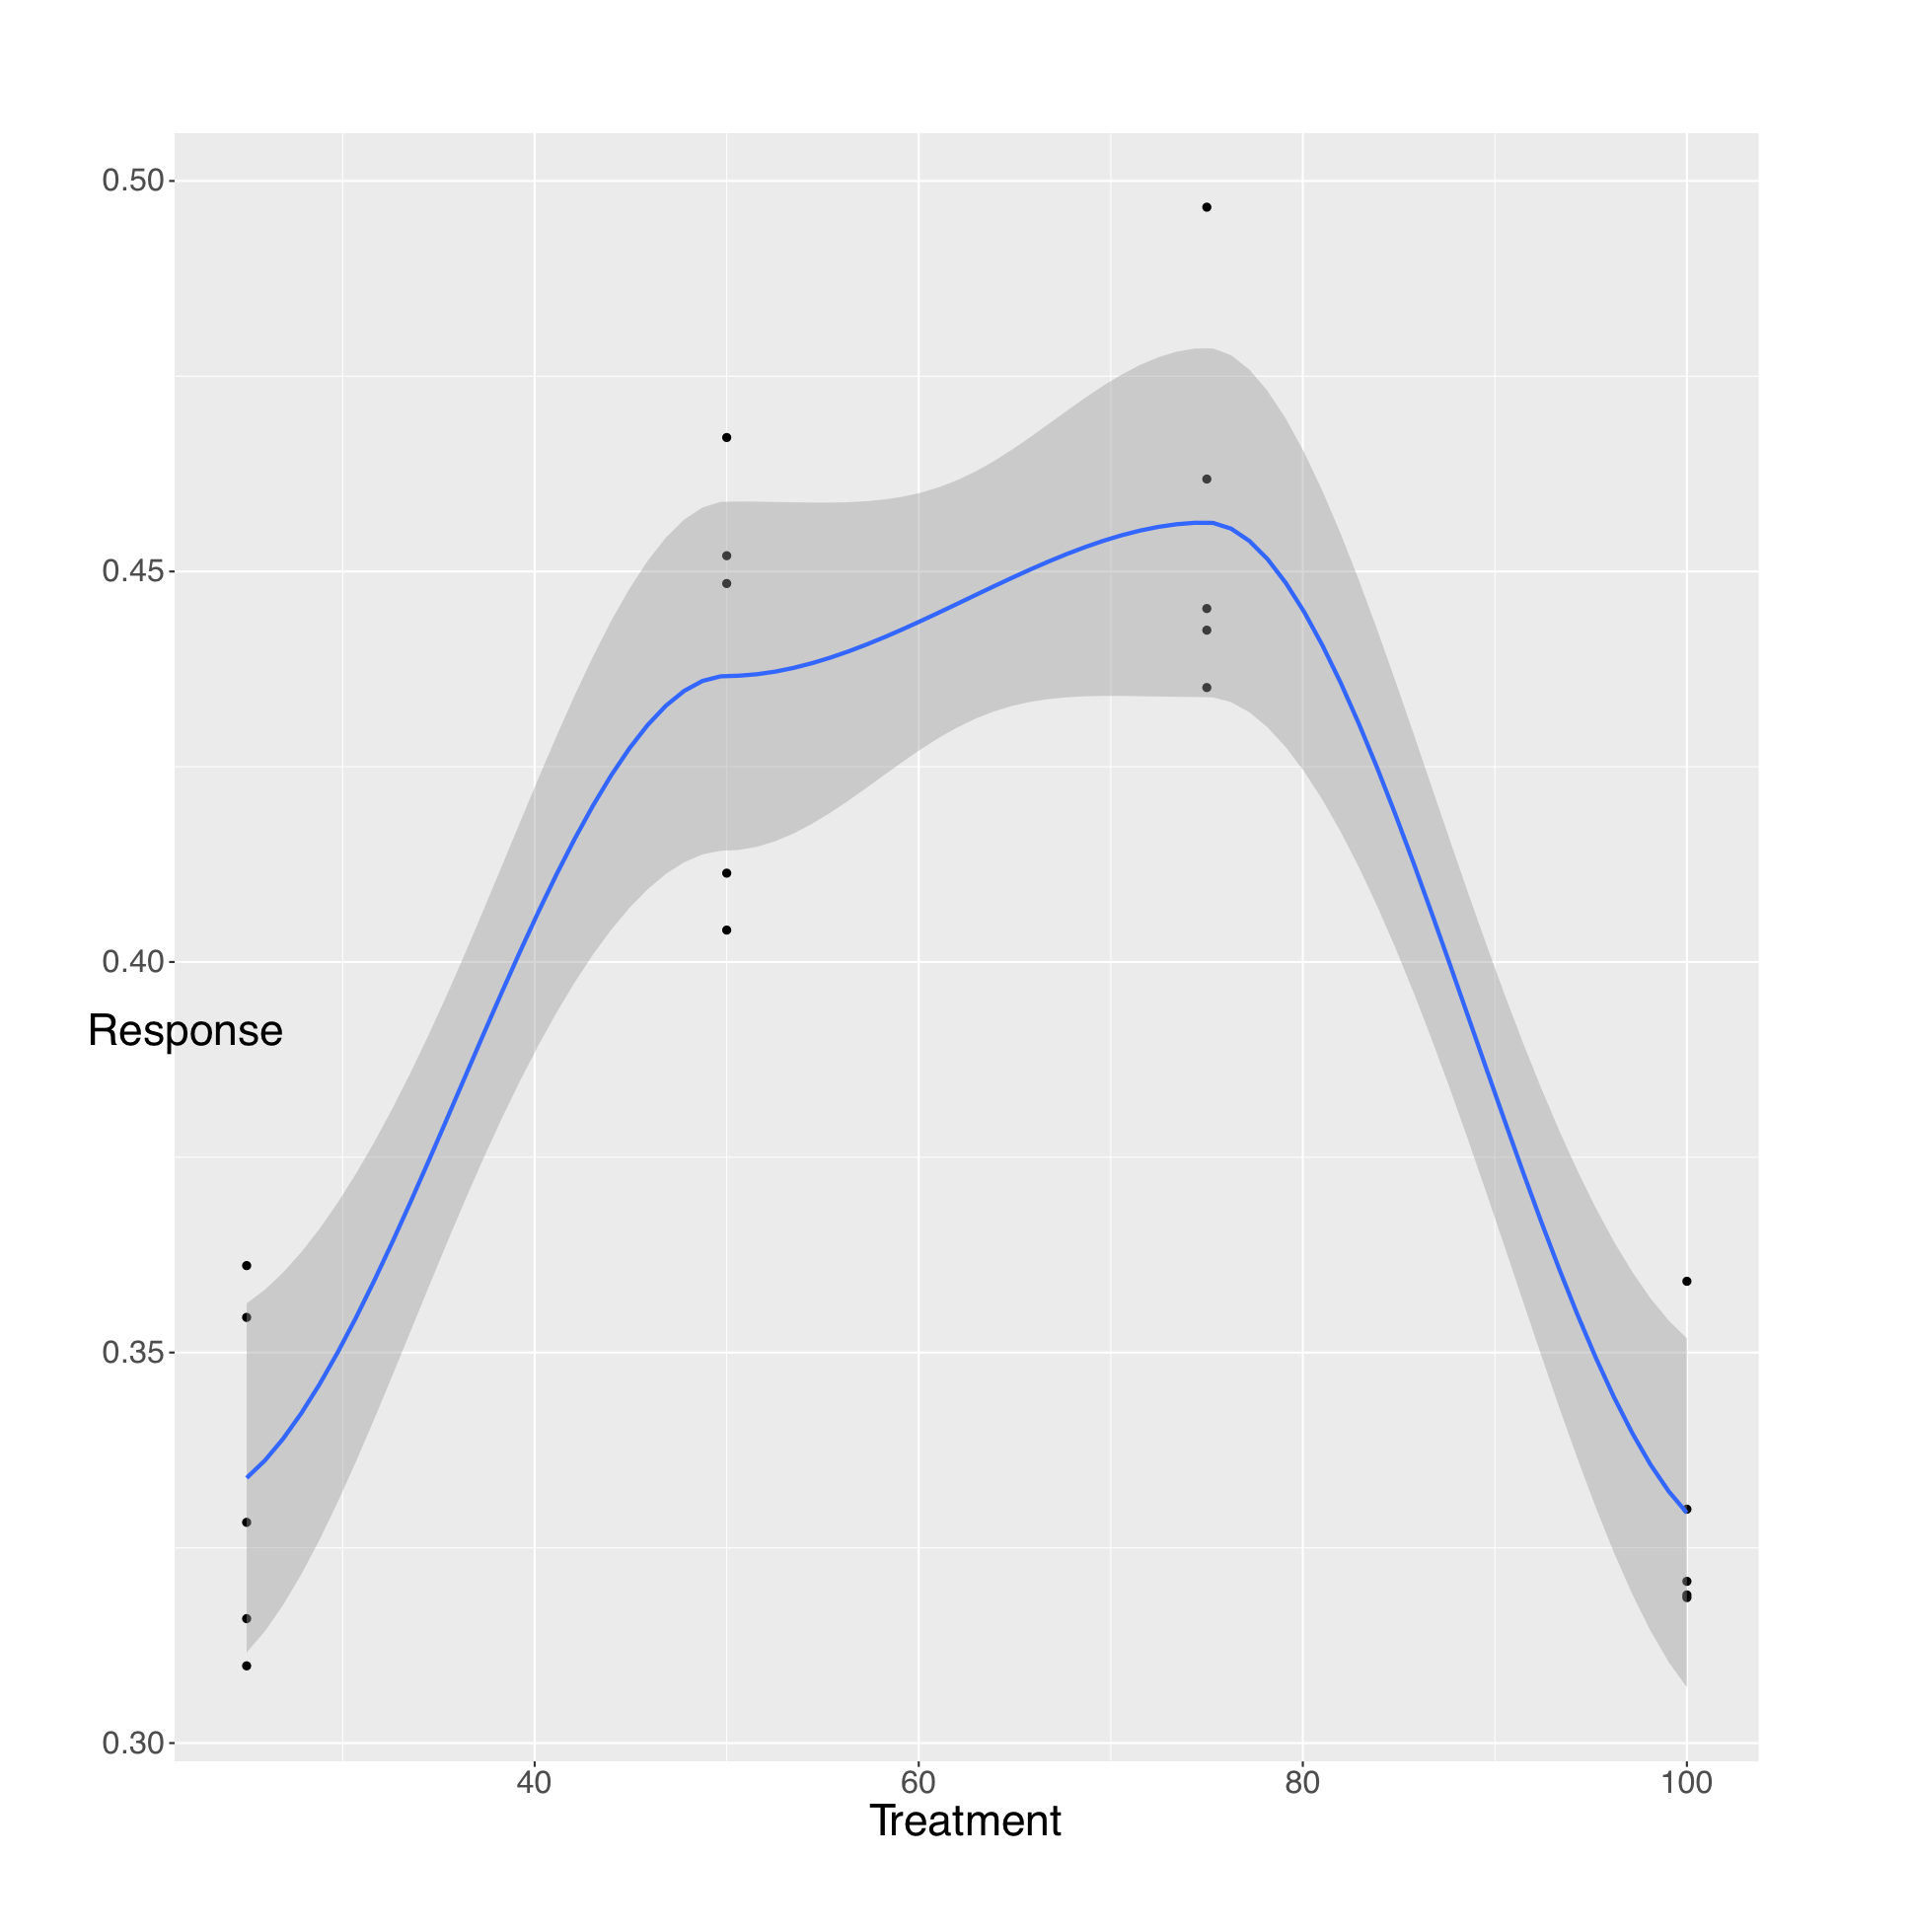
Visual inspection of your data is an essential first step. MEDDLE provides you with some basic plots (e.g. Figure 1). You can also use the “Export” function to generate an “export.csv” file. You can read the .cvs file into your favourite software package to generate other plots such as BoxPlots (Figure 2), simple linear regressions (not shown here because the data in Fig J1 are curvilinear), or LOESS curves and 95% CIs (Figure 3).
Intermediate steps
Once you’ve inspected the data, you may want to run some basic statistical analysis. In MEDDLE all the drivers are always “fixed factors”, the designs are fully factorial, and the data are drawn from a normal distribution (although you should check that the sample you’ve obtained from MEDDLE is normally distributed!). In this circumstance you might want to run a simple ANOVA in your favourite software package (see, e.g: http://rtutorialseries.blogspot.com/2011/01/r-tutorial-series-one-way-anova-with.html).
Advanced steps
For more complex designs, e.g. those including random factors, and/or non-factorial combinations of multiple drivers, you will need more complex analysis techniques. Since the analysis you need will depend on your particular question and experiment, we recommend you consult your favourite experimental analysis text book or your favourite pet statistician. Examples of the sorts of analysis you might think about applying to MEDDLE output include multivariate regression (surface fitting) or multi-factor linear models (ANOVA or Mixed-Effects models). e.g.:
https://www.statmethods.net/
Refining your experiment
Now that you have seen how your data sampled the landscape and had a chance to analyse your data, here are some questions to help you evaluate your experimental design, and redesign if necessary:
1. How well could you visualize and analyse your data?
Did the options you used work well?
2. Did your design adequately address your hypothesis/question?
Are you trying to address too many questions in one experiment?
Did the data you generated link back to enable you to make an informed comment about your hypothesis (this could, for example, be the first line of your discussion).
3. Does your design require fine tuning?
Have you under engineered your design, i.e. do you need to increase your levels of replication (under engineering is common in biological experiments)?
Have you over engineered your design, i.e. could you simplify your design and/or decrease your levels of replication? Would more driver levels with fewer replicates be more informative?
People often underestimate biological variability. If you think things look good, go back, increase your level of noise, and see if things still look OK.
4. How will you deal with outliers or missing data?
Increasing replication can help (NB that you should always include outliers in plots even if they are excluded from an analysis)
Are your data plotted on the appropriate scale? For example, growth data is often plotted on a log scale. The transformed data will have a different distribution than the raw data.
5. Would an alternative design better answer your question?