
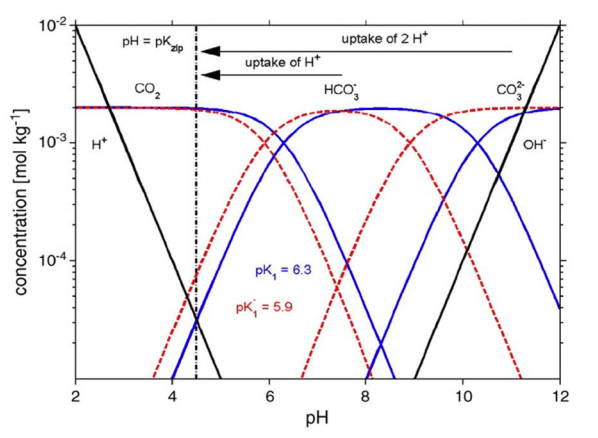
Concentrations of CO2, HCO3–, CO32-, H+, and OH– as functions of pH (Bjerrum plot) calculated using thermodynamic pK values for zero ionic strength (blue solid lines) or stoichiometric pK values (pK*) typical for seawater and used here for the simple system (red dashed lines). CO2 dominates for pH below pK1, CO32- above pK2, and HCO3– in between. The lines of [H+] and [HCO3–] cross at pH ≈ 4.5 (fresh water pK’s) and pH ≈ 4.3 (seawater pK’s). From Wolf-Gladrow et al. 2007. Mar. Chem. https://www.sciencedirect.com/science/article/pii/S0304420307000047