
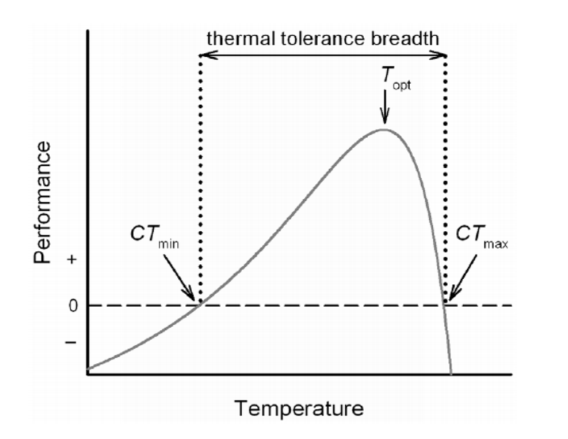
Example of typical response curves (also called reaction norms). Organismal responses to changes in temperature are often represented in response curves that plot temperature vs. some measure of performance. These curves can be characterised by their shape parameters.