
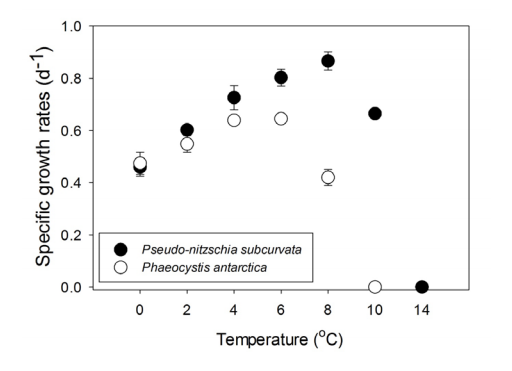
Thermal response curves for two Antarctic phytoplankton species, showing cell-specific growth rates (d-1) from 0°C to 14°C. Values are means and error bars are standard deviations of triplicate samples. (Zhu et al. 2017, Biogeosciences, doi.org/10.5194/bg-14-1-2017)